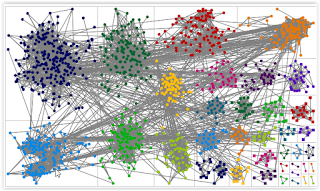
So, I started over and downloaded my matches for 4th cousins or closer. After creating a new file and again making sure the 'skip' information was included, I still had a blob -- just less dense.
Knowing this wasn't what it was supposed to look like, I dug thru her posts and the comments to discover that this whole process is more difficult with lots of data. One suggestion was to change the way the data was grouped. So I decided to try 'grouping by cluster'. That seemed to help since it separated the 'blobs'.
Even though it was still hard to visualize a DNA circle with the above graph, it was possible to click on a dot and see how that one dot was related to other dots (red lines). After some playing around, I figured out that the dark blue dots in the upper left contained a lot of my BRILES matches. So I'm wondering whether I can isolate certain branches of my tree by 'skipping' known matches from other branches of my tree.
Experiment #1: Isolating CRAWFORD line
- Sort Vertices by shared CM from largest to smallest
- Using data in 'notes', enter 'skip' in visibility field for known matches to other lines thru 150 matches
- Save file different name
- Refresh graph
Group by Cluster
Unfortunately, that didn't clear out enough data to make it easy to see the 'circles'.
Since my experimentation (playing around) didn't produce a graph anything close to the example, I'm going to give up for now and wait for the next blog post of suggestions.


